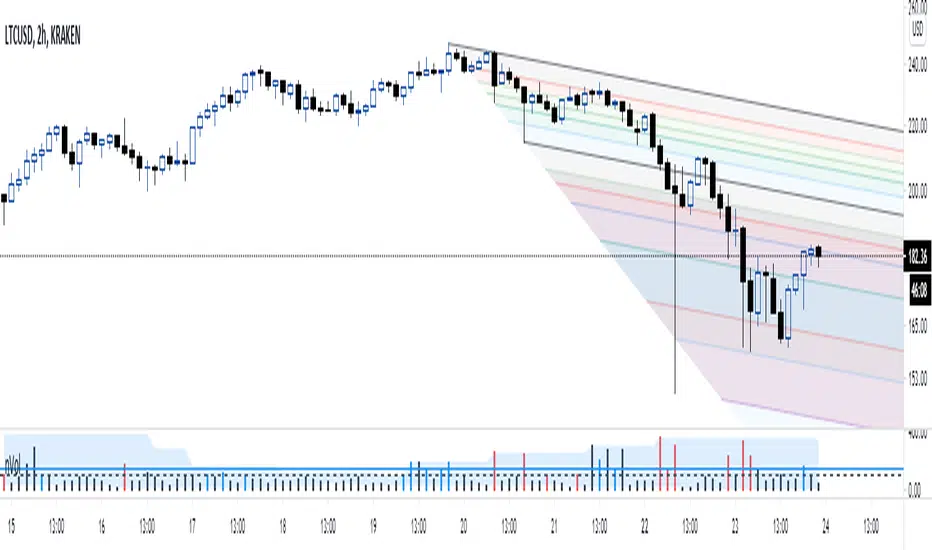
Relative Volume with Hull ma and Donchian channelA trader introduced the relative volume to me; I like the concept but its presentation doesn't fit my "visual" taste.
What I did was to color the relative volume bar based on the relationship among (1) hull moving average of the close (2) close vs. open and (3) the relative volume bar reading.
Red -> bearish price action with a lot of volume
Green -> bullish price action with a lot volume
Black -> no clear relationship between volume and price action.
I also added a Donchian channel to the relative volume to further gauge the strength of the relative volume.
All of my posts are for entertainment only.
Поиск скриптов по запросу "relative volume"
Relative VolumeHello traders,
"There's nothing new on Wall Street" is an age-old saying that still shows its relevance in modern day financial markets; volume still serves as a valuable tool for any trader just as it did for those that came and succeeded before us; in order to succeed in modern day markets one has to take it up a notch and dabble in complicated topics, like math. Now I dunno about you reader but I’m not keen on sitting around all day just to watch numbers on a screen; it’s pretty important to add some color into your life before it becomes dull but how can someone add colors into their trading toolkit as an aid rather than bother? With a bit of help from 3 other amazing open-source indicators you too can become a statistics enjoyer by combining math and colors to make pattern recognition much more intuitive and offering more peace of mind when trading. “Sir but how?”, glad you didn’t ask, it helps with simplifying statistics, in this case a Gaussian bellcurve
“HUH?”, you say? Alright class, Gaussian bellcurves for math dislikers 101 is in session
- Imagine that we have a bunch of numbers that we want to graph. We could just draw a line and plot the numbers on it, but that might not be very interesting.
- Instead, we can use the shape of a bell to show how many of each number we have.
- Let's say we have a lot of people and we want to graph how tall they are. We would start by making a line from the shortest person to the tallest person, and then we would draw the bell shape around the line.
- The bell shape is called a "Gaussian Bell Curve," and it shows us how many people are a certain height.
- In the middle of the bell, where it's the widest, we have the most people who are about average height. As we move to the sides of the bell, the curve gets lower because there are fewer people who are really tall or really short.
The bell curve discussed is the main idea for the candle coloring component of this indicator as being able to analyze the distribution of an entire dataset, in this case volume, can alert us when volume/participation in the market is away from its average using color, and therefore an opportunity could be present. Fair warning, it’s important to not strictly focus on volume as volume is meant to be confluence to the current structure of the market rather than causing tunnel vision.
Why 3 indicators to combine?
It starts with the RVOL by Mik3Christ3ns3n indicator as the backbone by calculating the average volume over a specified period of time, and then compares each new volume value to this average to determine whether it is above or below the average. The indicator then normalizes the volume data and calculates the z-score/standard deviation to determine whether the volume is within normal range or is an anomaly beyond a specified threshold which can also be set into an alert to aid in eyeing possible opportunities.
The code also includes Candle Coloring by Morty as it calculates a function to get the z-score for the size of the candle's body, and then compares it to the z-score for volume to determine whether the body size is a factor in the price action.
Finally, the code plots the anomalies and the normalized volume data on the chart using the first RVOL indicator mentioned, and colors the bars of the chart based on whether they are within normal range or are anomalies which comes from using code from veryfid's relative volume indicator.
Overall, this custom technical indicator is best used to identify unusual changes in trading volume, which may indicate potential price movements in the underlying.
How about some examples?
This first example is for my scalpers wanting to get in and out but not having much of an idea where or let alone how; using a tool like VWAP can be great for determining the area value to execute mean reversion trades once a speculator spots a colored candle anomaly at standard deviation band. Works best when VWAP is flat as it signals lack of conviction from both bulls and bears
This second example is for my fire and forget intraweek swing traders who want to execute a higher timeframe trend-following bias. A speculator starting 2023 off notices that the negative sentiment around Binance from late last year has quieted down and has conviction in upside after BTC began an uptrend as monthly VWAP (right chart) has began sloping up as well as a rally with momentum shown with the blue colored candle so the trader waits wait for a pullback for entry. On the chart to the left of the 4H the speculator notices a pullback into the area of interest to do business so a limit bid is left to enter for continued upside in Bitcoin through January 2023 just by keeping things simple
That’s really the main purpose of this indicator: simplicity of statistics for confluence using volume
Volume precedes price and price moves only for narrative to follow- why wait for your subjective Twitter timeline to give you a biased narrative to trade when you can use objective analysis by combining statistics and colors to allow for a cleaner execution process
“But what about risk management?” Glad you didn’t ask reader!
One last example then, we meet our trend following trader again feeling euphoric so they know profit taking season is coming soon but wants to leave emotion out of it. How to go about it? Same idea as our last trend following example: we see on the 4h chart to the right side shows Bitcoin lose and trade back within the 2nd standard deviation of quarterly VWAP which is telling our speculator that the uptrend has broken on top of which notices on the 30 minute chart on the left that aggressive market buyers have been steadily absorbed by limit sellers on multiple occasions of retesting 30,500 shown with the green colored candles and volume bars below, time to sell.
Turns out that selling was proactive risk management because price dumped thereafter
Hope this explanation gave you some useful insights on using statistics as colors from cherrypicked examples, remember that just because my examples are cherrypicked doesn’t invalidate these concepts at all as the market only does two things, initiate aggressive auctions and respond passively to auctions. This tool makes for seeing where that initiative aggressive activity is happening much simpler to deduce if others will respond to an anomaly of initiative aggressive activity or if the aggression will continue.
If there’s just one thing you take from this- simplicity above all, cheers and good luck

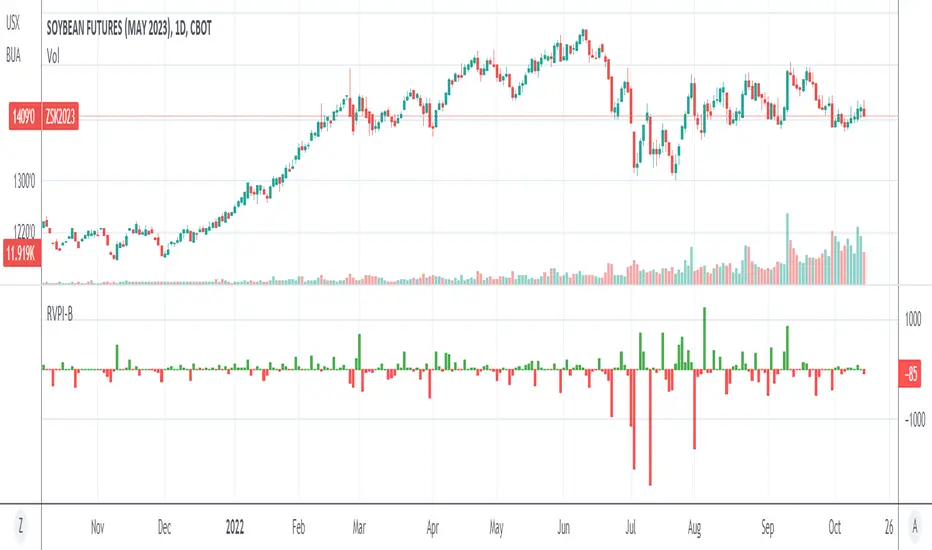
Relative Volume Prices Index by @WilliamBeliniWhat is the impact for Volume to the Prices?
To respond this question, I formulate the hipótesis if a little Volume change a lot the Price, it's a reversion signal, and if a lot of Volume change a little the price, it´s because the price is established.
This is one of 3 indicators created to improve this hipótesis, named:
1. Relative Volume Prices Index by @WilliamBelini (RVPI)
2. Relative Market Status by @WilliamBelini (RMS)
3. Trade Trigger RVPI by @WilliamBelini (TTR)
- The first show you the effect from volume to the prices, meas the sensibility of the variation;
- The second show you the feeling of the market by cicles, based at the cumulative average sensibility from the RVPI indicator;
- The third show you a trigger to trading positions, with the analysis of the historical RVPI data, based on the normal distribution of the futures price variation, by previos RVPI values and some rules created based on data behaviors identified.
To the end of this work, I can comprove the hipótesis, with simulations trading based from the TTR.
How we can´t monetize our work here, on TradingView platform, I´m disponibilize 2 of 3 indicators for you here free. If you want to have the third, discover how to contact with me (@ ;), and for me will be a pleasure to help you.
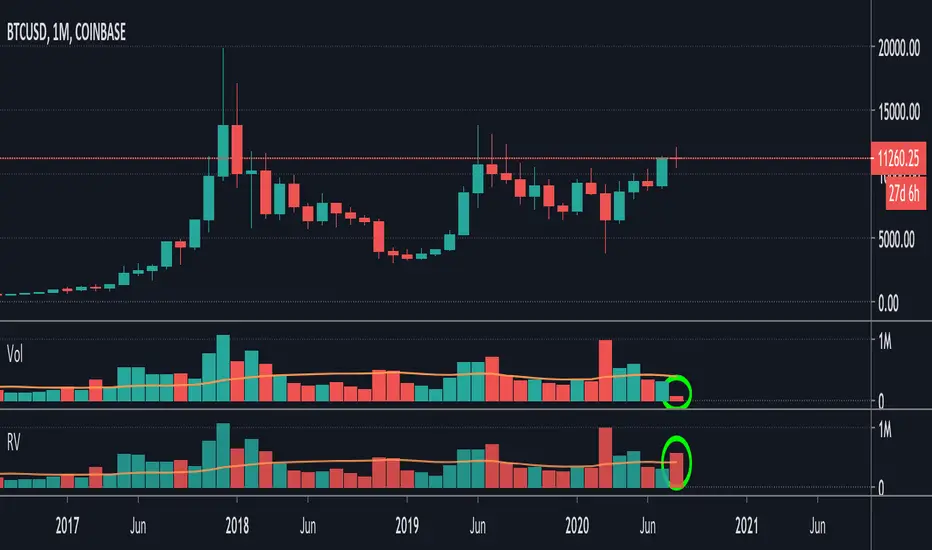
Relative VolumeIt is difficult to know how much volume is going on DURING the last bar,
therefore this "Relative Volume" (RV) script, previous bars are as usual, but the last one
adjusts the measured volume by comparing how much time passed and multiplying
this with the volume.
Examples:
Here (5 minute bar) there are 31 sec passed of the 5 minutes
The standard volume show little volume (since there is only 31s passed)
The "RV" multiplies this so you'll see how much this volume would be over 5 minutes,
IF everything goes the same for the rest of the 5'.
1' 5sec passed:
(so relatively more volume)
3' 4sec passed:
(With about 2' to go, you see there is a lot going on with the volime,
while seeing the standard volume, nothing much...)
Little 4' passed:
4,5':
Almost 5' gone:
Important:
This "RV" volume can diminish when during the bar the volume fades.
I think this can help evaluating the volume during the last bar
W example:
M example:
(You can clearly see that during the first 4 days there is a lot going on!)
Relative Volume Bars / Moving AverageThis indicator is highly experimental and settings are meant to be adapted to your time frame and asset of choice.
This indicator is a moving average that focuses on relative volume instead of all volume. It only factors in prices of candles that are meeting your relative volume input.
The multipliers can be used to smooth your average towards buy side or sell side or keep them the same.
I have also added in averages for buy side only and sell side only, these are highly experimental and turned off by default. Feel free to play with them.
This indicator is free to all Oasis Trading Group Members.
For Access or Questions Please Private Message Us, Thank you.

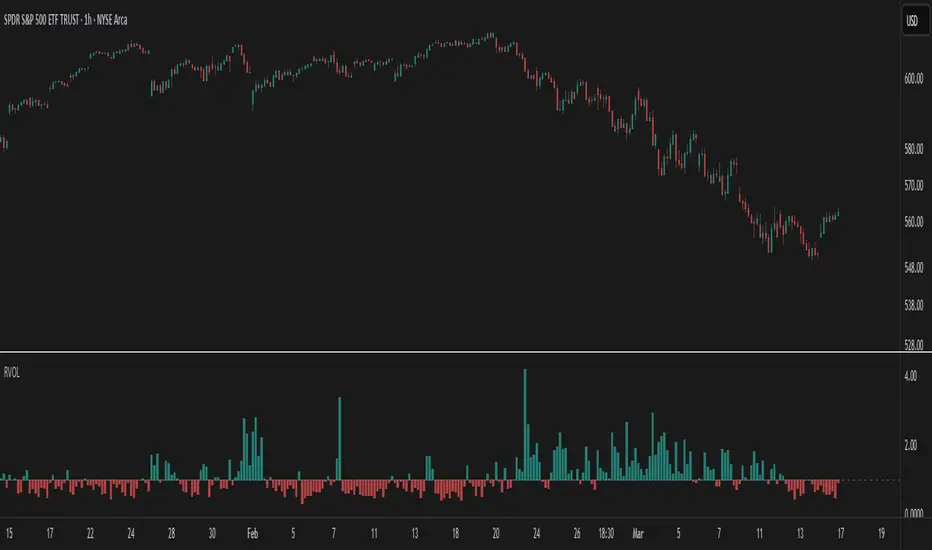
Relative Volume at TimeThe Relative Volume at Time indicator (RVOL) is a simple modification of the original Relative Volume at Time script available in TradingView’s public library. It doesn’t change how the indicator works but includes two small adjustments:
Added Color Options – The ability to customize the colors of the volume bars, which was important to me as I use this indicator all the time and wanted more visually suitable colors.
Renamed Short Title – The abbreviation "RVOL" replaces "RelVol", as it's a more commonly used term in trading.
Aside from these small tweaks, the indicator retains all of its original functionality, including the ability to set an anchor timeframe, choose between Regular and Cumulative volume calculation modes, and adjust unconfirmed volume for incomplete bars.
This version exists simply because I needed a more personalized display for an indicator that I rely on daily.
How It Works
The Relative Volume at Time indicator compares the current volume to the average volume at the same time in previous sessions. This helps determine if today’s activity is higher or lower than usual.
Examples
On a daily chart (1D timeframe, length = 10), each volume bar compares today's volume to the average volume at the same time over the last 10 days. If today’s volume is higher than usual at this moment, the bar will reflect that.
On an hourly chart (1H timeframe, length = 5), each hourly volume bar compares the current hour’s volume to the same hour in the past 5 days. If the 10 AM bar is high, it means today's 10 AM volume is greater than the average of the past 5 sessions at 10 AM.
On a weekly chart (1W timeframe, length = 8), the indicator compares this week’s volume to the average of the last 8 weeks. A higher bar means this week is seeing significantly more volume than usual.
This logic applies to any timeframe. It always compares the current volume to past volumes at the same point in time.
@Julien_Eche
Relative Volume (RVOL) - ATR - R4RocketHello !!
This is a big upgrade on my earlier Indicator called "RVOL - R4Rocket". I could have updated the existing script, but there were two reasons for me to not do so.
1. I changed a lot of the previous code and added a lot of statistics like
a. Intraday Daily ATR Plot
b. Progressive (High - Low) Range as % of Daily ATR
c. % of RVOL Days in available chart data in any timeframe
d. In the new script RVOL Sectional has been removed as I did't find it very useful (Old script still has that feature)
e. And lastly and greatly, I modified the actual RVOL code (Huh ? Well I'll explain what I mean by this below)
2. Earlier I named my script just as RVOL. But then I though, well not everyone is going to search "Relative Volume" Indicator as "RVOL" Indicator, right? And Then during my second update I even tried to see whether I can change the script name but I couldn't figure it out. (Maybe it's not possible or maybe you know, "I DON'T HAVE ENOUGH BRAIN POWER" :P). So in order to make my script more accessible and easy to find for everubody so that it may add a little value to them in their trading, I'm changing the name of the script in this publication to "Relative Volume (RVOL) - ATR - R4Rocket". (Quite a big name, don't you think?)
Now as my reasons are out of the way, let me tell you about the indicator and the available options.
First let me explain what is RVOL basically. (Even after making 4 updates to my last script, I forgot to explain this......BIG BRAIN POWER :P)
It is calculated as (Cumulative sum of volume till time t from the start of the session) divided by the (Average of same period volume over a given number of days).
Lets say market starts at 09:30 am and right now the time is 10:00 am. So what RVOL does is it takes the sum of volume done from 9:30 am to 10:00 am for today and divides it by the same average volume that occurred between 9:30 to 10:00 in lets say X number of last days.
What this does is gives you the means to quantify how much everybody is interested today in the given stock w.r.t last X days. Generally higher the RVOL value - higher the public interest (due to some known or unknown reason like results / news / market condition etc) - and hence higher is the probability of stock movement on intraday basis. (Mostly everybody prefers to trade stocks intraday with RVOL > 2)
Now let's get back to the changes and the features.
1. It calculates Relative Volume
Adjusted in a way that the recent volume spike (e.g say due to quarterly result announcement or some other big news) don't skew the next day's
RVOL calculation. What this will do is, it will give you a good idea whether the stock is still in play the next day or a day after that.
LIGHTS !! CAMERA !! ANNNNNNDD ACTION !! (I love to watch movies, not very relevant here I know, but couldn't help it :P)
Now you can see in the image below the difference between old and new script RVOL calculations. This will help you to find out 2nd Day, 3rd Day plays.
To calculate RVOL first you have to choose your local exchange trading hours
E.g. NSE (India) trades from 09:15 to 15:30
NASDAQ (USA) trades from 09:30 to 16:00
LSE (UK) trades from 08:00 to 16:30 etc
Then you have to choose the RVOL period. This is the lookback period for cumulative volume average calculations.(I suggest using default value of 4 but it depends upon your preference and one more thing to note is that too high of a value will not even load the script due to some constraints that I don't know)
And last parameter is RVOL Trigger = What RVOL value YOU CONSIDER IMPORTANT. (I like 2 and if RVOL > RVOL Trigger then the columns will turn Green otherwise they will be Red. SIMPLE !!)
You can use any timeframe from 1 min to 1 Day. (Even custom timeframes like 2,4,6 will work fine)
1 min Chart
2 min Chart
2. It calculates Daily ATR in % terms of the day's open and plots it on intraday charts (and on daily charts too, if you want)
It's just what I just said - plain & simple.
You can see it in the image below. (Yellow dotted line and value in yellow color)
This will help you if you use profit targets or stop losses based on previous day's ATR values.
All you have to do is tick the Plot Daily ATR % box in inputs and choose the ATR Average.
3. The indicator calculates (High - Low) range as and when it extends throughout the day as the % of Daily ATR
This will help you quickly in finding which stocks are trading with extreme volatility.
Can be seen in the image below where the stocks trade @ almost 3 times or 300 % of the previous days ATR (Blue dotted line and value in blue color)
4. And lastly it gives you the statistic that will tell you how much is the average % of total days are RVOL days. (Did you get that ? It sounded great in my head but really don't know what I just said)
Let me tell you in terms of numbers. Lets say on daily timeframe Tradingview provides some 5000 bars worth of historical data. Out of that there were 16% days where RVOL was more than 2. Roughly speaking if you were to trade this stock every day then you would find on an average about 3 days per month with RVOL > 2.
(If you reduce the RVOL Trigger, then you will get more % RVOL days. In the second image if you reduce RVOL Trigger to 1.5 then you will have almost 27 % good trading days AS PER YOUR DESIRED & DEFINED PARAMETER OF RVOL TRIGGER = 1.5. Which translates to almost 6 days per month. You can play with it as you want and deem fit.)
RVOL Trigger = 2
RVOL Trigger = 1.5
“The goal of a successful trader is to make the best trades. Money is secondary.” – Alexander Elder
With best regards.
R4Rocket

Indicator: Relative Volume Indicator & Freedom Of MovementRelative Volume Indicator
------------------------------
RVI is a support-resistance technical indicator developed by Melvin E. Dickover. Unlike many conventional support and resistance indicators, the Relative Volume Indicator takes into account price-volume behavior in order to detect the supply and demand pools. These pools are marked by "Defended Price Lines" (DPLs), also introduced by the author.
RVI is usually plotted as a histogram; its bars are highlighted (black, by default) when the volume is unusually large. According to the author, this happens if the indicator value exceeds 2.0, thus signifying that a possible DPL is present.
DPLs are horizontal lines that run across the chart at levels defined by following conditions:
* Overlapping bars: If the indicator spike (i.e., indicator is above 2.0 or a custom value)
corresponds to a price bar overlapping the previous one, the previous close can be used as the
DPL value.
* Very large bars: If the indicator spike corresponds to a price bar of a large size, use its
close price as the DPL value.
* Gapping bars: If the indicator spike corresponds to a price bar gapping from the previous bar,
the DPL value will depend on the gap size. Small gaps can be ignored: the author suggests using
the previous close as the DPL value. When the gap is big, the close of the latter bar is used
instead.
* Clustering spikes: If the indicator spikes come in clusters, use the extreme close or open
price of the bar corresponding to the last or next to last spike in cluster.
DPLs can be used as support and resistance levels. In order confirm and refine them, RVI is used along with the FreedomOfMovement indicator discussed next.
Freedom of Movement Indicator
------------------------------
FOM is a support-resistance technical indicator, also by Melvin E. Dickover. FOM is the ratio of relative effect (relative price change) to the relative effort (normalized volume), expressed in standard deviations. This value is plotted as a histogram; its bars are highlighted (black, by default( when this ratio is unusually high. These highlighted bars, or "spikes", define the positioning of the DPLs.
Suggestions for placing DPLs are the same as for the Relative Volume Indicator discussed above.
Note that clustering spikes provide the strongest DPLs while isolated spikes can be used to confirm and refine those provided by the Relative Volume Indicator. Coincidence of spikes of the two indicator can be considered a sign of greater strength of the DPL.
More info:
S&C magazine, April 2014.
I am still trying these on various instruments to understand the workings more. Don't forget to share what you learn -- any use cases / ideal scenarios / gotchas, would love to hear them all.

Relative Volume (RVOL) + Average Volume [AZ]The script helps you instantly see whether today’s volume is unusual compared to the past (relative volume). It’s built for breakout/fakeout filters, like the 15-minute ORB strategy you’re running.
Relative Volume + Z-score + Normal Volume + Avg. VolumeA statistical way to visualize volume analytically compared to traditional volume. All Lookback Periods and Colors can be changed so user can make it feel personalized
- Relative Volume (RVOL) visualizer with the color of the histogram bar changing to represent exceeding a threshold specified by the user
For example --> (1.5 = Orange Bar) & (2 = Red Bar)
- Toggle View between RVOL visualization of volume vs. normal view of volume plot
- Z score lookback for volume across specified lookback per what user wants (dot/symbol above the bar)
- Average Volume Plot

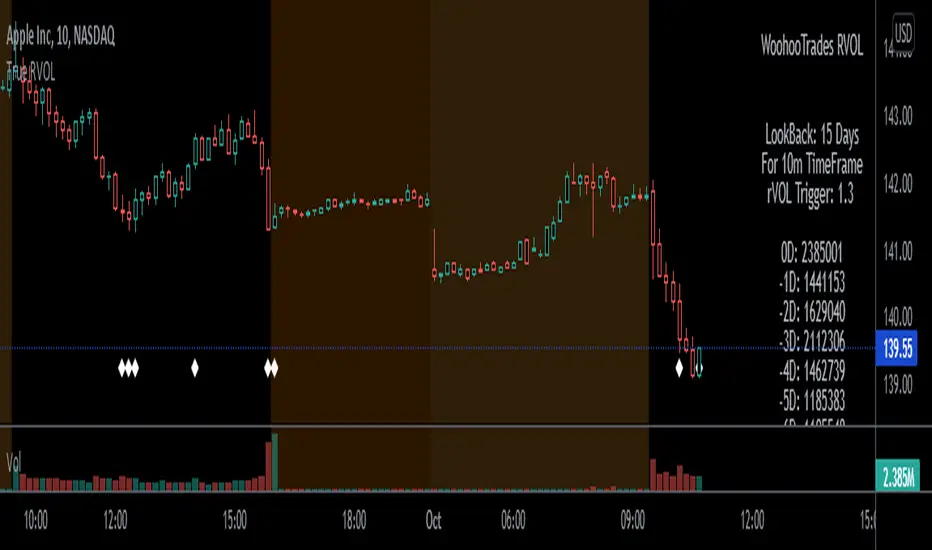
True Relative VolumeRelative Volume shows traders how "in-play" a current stonk is. Works great for day traders and scalpers!
Volume of Current TimeFrame's ratio to the average volume over X days back on the same time frame.
ie .
z = Volume at 0930-0940am over X days period divided by X
rVol = current volume divided by z
Dots at the bottom to indicate candles whose RVOL is morethan set minimum ratio.
Yes, its only 5 and 10 minutes. Might do calculations for other timeframes if this gets a good following.
Only works on US market session. 0930am to 0400pm EST.
Play Strategies :
- on break of support/resistance, if rvol supports action, ride direction of price action.
- look for in-play names, wait for price action to return to support/resistance area on low volume then
revisit if a bounce on the support/resistance line is supported by rVol again.
REMINDER!!!
This works only on 5 and 10 minutes TF. Dont forget to change your chart's timeframes.
This script will calculate erroneously if timeframe set on script and chart's current time frame are different.
Works even if extended market is enabled on your charts. It only looks at 0930 - 1600 EST bars.
Enjoy! Would love to hear your thoughts.
Relative Volume Screener AlertsThis script will screen 12 different stocks and current chart (13 in total) for entry points from my relative volume indicator.
1. Enter in any ticker ID's from charts you wish to scan in the settings.
2. Go to desired timeframe.
3. Click add alert button at top toolbar.
4. Select RVOL Screener Alerts indicator, input alert notification settings and/or change alert name and click create.
The script will then scan the stocks and alert you of any entry points from the timeframe you set the alerts.
A new alert needs to be created for each timeframe you wish to screen.
You can find my relative volume indicator here:

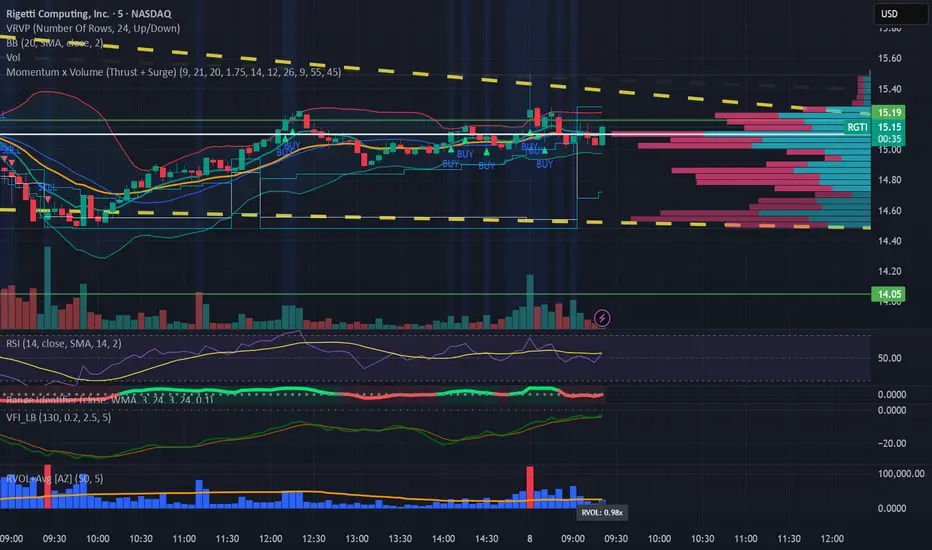
Relative VolumeVolume can be a very useful tool if used correctly. Relative volume is designed to filter out the noise and highlight anomalies assisting traders in tracking institutional movements. This tool can be used to identify stop loss hunters and organized dumps. It uses a variety of moving averages to hide usual activity and features an LSMA line to show trend. Trend columns are shown to highlight activity and can be seen at bottom of the volume columns, this is done using ZLSMA and LSMA.
The above chart shows an example of 2 indicators being used on the 15 min chart. The bottom indicator is set to the 1 min chart. Traders can see a large dump on the 1 min chart as institutions wipe out any tight stop losses. Next they buy back in scooping up all those long positions.
This is an example layout using a split screen setup and multiple timeframes ranging from 1 min to 30 mins. This gives a clear indication of trends and make it easy to pickup on institutional behaviour. Tip: Double clicking indicator background will maximize RVOL to the split screen window.

M3EDGE™ Relative Volume (RVOL)Relative Volume (RVOL) compares the current volume to its historical average.
🎯 Goal: Spot abnormal flows and anticipate impulsive moves.
🔍 M3EDGE™ Key Reading:
• RVOL > 2.0 → Likely institutional activity.
• RVOL > 1.5 → Heightened surveillance: potential move building.
• Price falling + high RVOL → Stealth accumulation / sell-side absorption.
• Price rising + high RVOL → Confirmed breakout with real flows.
💡 In the M3EDGE™ method, RVOL filters out false signals and validates setups by aligning flow + structure + momentum.
Applied to ETFs or stocks, it reveals what price action alone won’t show

Relative volume zone + Smart Order Flow Dynamic S/ROverview:
The Relative Volume Zone + Smart Order Flow with Dynamic S/R indicator is designed to help traders identify key trading opportunities by combining multiple technical components. This script integrates relative volume analysis, order flow detection, VWAP, RSI filtering, and dynamic support and resistance levels to offer a comprehensive view of the market conditions. It is particularly effective on shorter timeframes (M5, M15), making it suitable for scalping and day trading strategies.
Key Components:
1. Relative Volume Zones:
• The script calculates the relative volume by comparing the current volume with the average volume over a defined lookback period (volLookback). When the relative volume exceeds a specified multiplier (volMultiplier), it indicates a high volume zone, signaling potential accumulation or distribution areas.
• Purpose: Identifies high-volume trading zones that may act as significant support or resistance, indicating possible entry or exit points.
2. Smart Order Flow Analysis:
• The indicator uses Volume Delta (the difference between buying and selling volume) and a Cumulative Delta to detect order imbalances in the market.
• Order Imbalance is identified using a moving average of the Volume Delta (orderImbalance), which helps highlight hidden buying or selling pressure.
• Purpose: Reveals market sentiment by showing whether buyers or sellers dominate the market, aiding in the identification of trend reversals or continuations.
3. VWAP (Volume Weighted Average Price):
• VWAP is calculated over a default daily length (vwapLength) to show the average price a security has traded at throughout the day, based on both volume and price.
• Purpose: Provides insight into the fair value of the asset, indicating whether the market is in an accumulation or distribution phase.
4. RSI (Relative Strength Index) Filter:
• RSI is used to filter buy and sell signals, preventing trades in overbought or oversold conditions. It is calculated using a specified period (rsiPeriod).
• Purpose: Reduces false signals and improves trade accuracy by only allowing trades when RSI conditions align with volume and order flow signals.
5. Dynamic Support and Resistance Levels:
• The script dynamically plots support and resistance levels based on recent swing highs and lows (swingLookback).
• Purpose: Identifies potential reversal zones where price action may change direction, allowing for more precise entry and exit points.
How It Works:
• Buy Signal:
A buy signal is generated when:
• The price enters a high-volume zone.
• The price crosses above a 5-period moving average.
• The cumulative delta shows more buying pressure (cumulativeDelta > SMA of cumulativeDelta).
• The RSI is below 70 (not in overbought conditions).
• Sell Signal:
A sell signal is generated when:
• The price enters a high-volume zone.
• The price crosses below a 5-period moving average.
• The cumulative delta shows more selling pressure (cumulativeDelta < SMA of cumulativeDelta).
• The RSI is above 30 (not in oversold conditions).
• Dynamic Support and Resistance Lines:
Drawn based on recent swing highs and lows, these lines provide context for potential price reversals or breakouts.
• VWAP and Order Imbalance Lines:
Plotted to show the average traded price and highlight order flow shifts, helping to validate buy/sell signals.
How to Use:
1. Apply the Indicator:
Add the script to your chart and adjust the settings to match your trading style and preferred timeframe (optimized for M5/M15).
2. Interpret the Signals:
Use the buy and sell signals in conjunction with dynamic support/resistance, VWAP, and order imbalance lines to identify high-probability trade setups.
3. Monitor Alerts:
Set alerts for significant order flow events to receive notifications when there is a positive or negative order imbalance, indicating potential market shifts.
What Makes It Unique:
This script is unique because it combines multiple market analysis tools — relative volume zones, smart order flow, VWAP, RSI filtering, and dynamic support/resistance — to provide a well-rounded, multi-dimensional view of the market. This integration allows traders to make more informed decisions by validating signals across various indicators, enhancing overall trading accuracy and effectiveness.

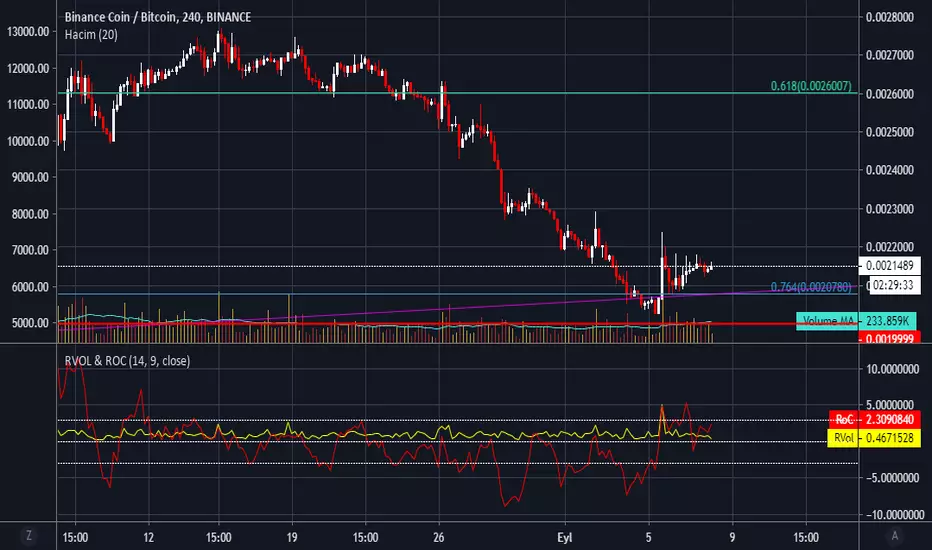
RVol & RoC - Relative Volume & Rate of Change by haciyatmazRelative Volume ( RVol ) is a critical measure of volume flows. It measures current volume in relation to the "usual" volume for this time of the day.
Rate of Change ( RoC ) is a momentum-based technical indicator that measures the percentage change in price between the current price and the price a certain number of periods ago.
Multi Exchange Relative Volume IndicatorThe Multi Exchange Relative Volume indicator is a powerful tool designed to visualize the relative volume across different exchanges. This is particularly useful for decentralized securities like forex and crypto, where volume data is spread across multiple markets. By aggregating volume data from various exchanges, this indicator helps traders identify trends, spot unusual volume spikes, and make informed trading decisions.
Key Features:
Multi-Exchange Volume Aggregation: Collects and sums the volume data from up to five different exchanges, offering a holistic view of the market activity.
Customizable Inputs: Easily select and configure up to five different exchanges of your choice to monitor their volume activity.
Relative Volume Visualization: Compares the aggregated volume against historical averages to highlight periods of high or low volume.
Color-Coded Volume Bars: Volume bars are color-coded based on the relative volume percentage, providing quick visual cues:
- Red for volume 1.0-1.5 times the average
- Orange for volume 1.5-2.0 times the average
- Green for volume 2.0-3.0 times the average
- Yellow for volume greater than 3.0 times the average
- Grey for below average volume
Dynamic Lookback Period: Adjust the lookback period to suit your trading style and timeframe, allowing for flexible analysis.
Exponential Moving Average (EMA): Includes an EMA of volume to smooth out short-term fluctuations and highlight longer-term trends.
Scalable Layout: The scaling factor allows you to zoom in or out, adjusting the visual representation of volume data to better fit your chart.
Usage:
Configure Exchanges: Select up to five exchanges you want to monitor from the input settings.
Set Lookback Period and Bars: Customize the lookback period and the number of bars to consider for calculating average volume.
Adjust Scaling: Use the scaling factor to zoom in or out on the volume data for better visualization.
Interpret Volume Bars: Analyze the color-coded volume bars to identify significant changes in volume and potential trading opportunities.
Monitor EMA: Use the EMA line to understand the trend and smooth out noise from the volume data.
The Multi Exchange Relative Volume indicator is an essential tool for traders who want to gain deeper insights into market activity across multiple exchanges. By visualizing relative volume, it helps in identifying potential breakout or breakdown points, enhancing your trading strategy.

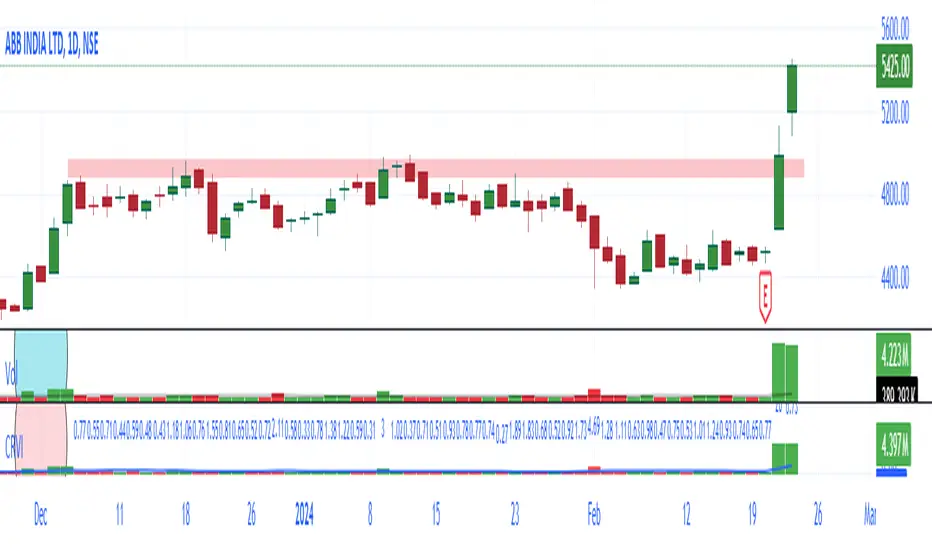
NSE + BSE Volume with Relative Volume Multiplier By AfnanIntroducing the Combined NSE + BSE Volume Indicator with Relative Volume indicator (CRVI).
The Combined NSE + BSE Volume Indicator with Relative Volume Multiplier (CRVI) is an essential tool for Indian traders who are engaged in volume breakout analysis, particularly breakout traders.
Key Features of CRVI:
Combining NSE and BSE Volume: The CRVI consolidates volume data from both the National Stock Exchange (NSE) and the Bombay Stock Exchange (BSE) into a single chart, ensuring that traders do not miss out on vital volume data from either exchange.
Understanding Operator Activity: This indicator gives traders the advantage of identifying whether operators or smart investors are building positions in either exchange. For instance, while observing an NSE stock chart, traders can now identify if operators are building positions in BSE stocks as well.
Add-on to Relative Volume / Volume Breakout Multiplier (RVI) Indicator: The CRVI is an additional feature integrated into the Relative Volume / Volume Breakout Multiplier (RVI) indicator, providing an enhanced perspective on volume dynamics.
Usage of CRVI:
Quantifying Volume Breakouts: The indicator quantifies the degree of volume breakouts concerning the Simple Moving Average (SMA), facilitating a clearer understanding of the strength of volume breakouts.
Relative Volume Interpretation: By comparing the current volume with the volume SMA, the CRVI delivers a breakout number, such as 2.0 for double the volume SMA or 0.50 for half the volume SMA. This assists traders in gauging the momentum and potential trading opportunities more effectively.
Advantages for Traders:
Enhanced Volume Analysis: Breakout traders, in particular, will find the CRVI invaluable for identifying potential trading opportunities and assessing volume strength more accurately.
Essential Toolkit Inclusion: Traders focusing on volume breakout analysis can benefit significantly from incorporating this indicator into their trading toolkit.
Embracing Continuous Improvement:
Every tool and analysis utilized contributes to the ongoing process of becoming more adept traders. Embracing continuous learning and improvement is the foundation of successful trading. As we move forward, armed with the right tools and mindset, we eliminate the doubts of today and pave the way for a more confident tomorrow.
Gratitude :
Your support, likes, and comments are deeply appreciated. If you have any questions, do not hesitate to reach out. Let's work together to make trading an enriching experience!
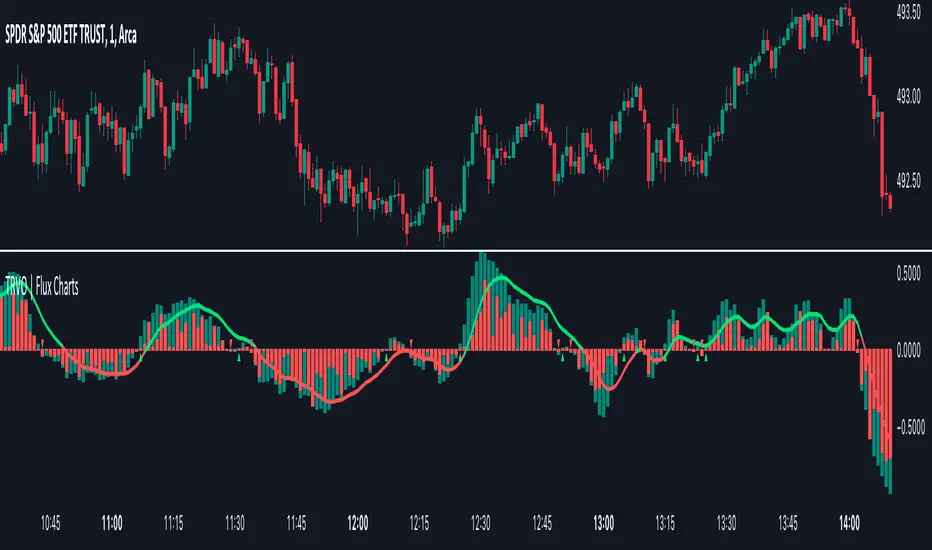
Time Relative Volume Oscillator | Flux Charts💎 GENERAL OVERVIEW
The relative volume indicator aims to improve upon the default existing relative volume indicator by comparing volumes between previous trading sessions rather than previous candles. As such, it works best on lower time frames as there is more data to compare with. The purpose of the indicator is to show how the current bar’s volume compares to the volume at the same time on previous trading days.
There exists a couple different modes and combinations that each provide a different perspective on the trading volume.
Oscillator mode
Oscillator mode starts with the same relative volume calculation, but adds two EMAs of different lengths that diverge and converge. Like the MACD, it plots the difference as a histogram. This functions as an easy way to view when relative volume is increasing or decreasing.
How to use:
The oscillator oscillates between -1 and 1. It moves along with volume direction, so this mode can be used to view the current volume direction in a lagging fashion. In oscillating markets, this indicator can give an idea of how buy/sell volume is moving and where it currently stands. Small arrows mark where reversals are predicted, when the histogram crosses over 0. The biggest pitfall of this mode is that, in a straight trending market, the two EMAs converge and it gives a false reversal signal.
Delta mode
Delta volume mode is a step up from the buy/sell volume mode. It separates both sides into the top and bottom, while also displaying the actual volume behind it in a semi transparent overlay. The best feature, however, is the delta oscillator. This oscillator fluctuates depending on how buy/sell volume is changing and plots bullish/bearish labels when the dominant side (bullish/bearish) changes. The signals, while a bit common, can sometimes dictate large direction changes, started by a dominant volume switch.
On top of different display modes, there is also one more volume mode: buy/sell volume. Instead of only showing the total volume and relative volume, it calculates and separates buying and selling volume.
This volume mode displays differently in all three viewing modes, but the basic principle is the same. It adds a vital piece of information to the chart without adding clutter. The calculation for buy/sell volume uses the candle wicks and body to compare bullish and bearish movement.
Classic mode
Classic mode takes the default volume indicator and improves upon it by also displaying the relative volume on top of the actual volume. Relative volume is calculated similarly between the three display modes: simply by comparing the current bar’s volume to the volume at the same time during previous trading days. Classic mode displays this “relative volume” as well as a simple EMA over top of the actual trading volume.
Originality
The script improves upon the existing relative volume indicator by using previous trading days rather than previous candles to generate the relative volume. On top of that, the calculation methods are unique, using different formulas like variations of the sigmoid function to smooth noise. The main issue this script aims to fix is that towards the start or end of the day relative volume indicators all see spikes as volume grows into close. The new relative volume calculations fix this problem and show what the “true” relative volume is because they compare the current bar to the “same” bar on previous trading sessions.
RVOL Relative Volume - IntradayHello All,
Relative Volume is one of the most important indicators and Traders should check it while trading/analyzing. it is used to identify whether the volume flows are increasing or decreasing. Relative volume measures current volume in relation to the “usual” volume for this time of the day. What is considered “usual"? For that, we have to use a historical baseline known as the average daily volume. That means how much volume a security does on a daily basis over a defined period. (This scripts runs on the time frames greater or equal 1 minute and less than 1 day)
The common definition for real-time relative volume is: Current volume for this time of day / Average volume for this time of day. It does not mean taking the volume (for example) from 10:30 am to 10:45 am and comparing it to what it does from 10:30 am to 10:45 am every day. What it truly means is to compare cumulative volumes. Therefore, this is the precise definition of real-time relative volume:
Current cumulative volume up to this time of day / Average cumulative volume up to this time of day
What should we understand while checking RVOL;
- Relative volume tell us if volume flows are increasing or decreasing
- A high relative volume tells us that there is increased trading activity in a security today
- Increased volume flows often accompany higher volatility i.e. a significant price move
Let see an example:
P.S. if you want to get more info about RVOL/Relative Volume then you can search it on the net. While developing the script this was used as reference, you can also check it for more info.
Enjoy!

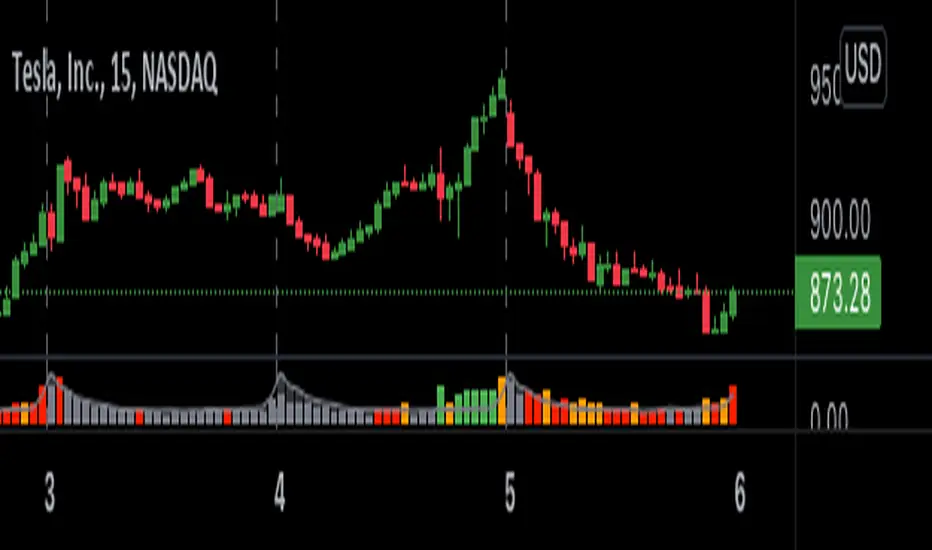
OPINICUS VOLUME DATA - Time Of Day Relative Volume (RVOL)This tool calculates the relative volume (RVOL) based on the normal average volume at that particular time of day.
Relative volume is a powerful piece of information because it offers a gauge as to whether a stock is in play or not. If RVOL is less than 1 it is not in play on this trading day or during this timeframe. If RVOL is above 2, it IS in play and can potentially be traded.
This script allows you to determine if relative volume is average, above average, 2x, or 3x via different color volume bars, at that particular time of day.
There are 2 different settings on this volume indicator.
The first setting is "Gradient." This is the preferred setting, and the one I personally use. Gradient is going to show you different color volume bars based on the RVOL multiple.
The color scheme is as follows:
Gray for average volume
Red if RVOL is between 1.0 and 1.5
Orange if RVOL is between 1.5 and 2
Green if RVOL is between 2.0 and 3.0
Lime green (bright green) if RVOL is greater than 3.
The second setting is "Price." This setting simply shows you the color of the candlestick. This is useful if you find the gradient setting to be too distracting, but still want to see if there is increased relative volume.
There is an alerts setting, which I find to be useful but can also be very distracting. If you leave the "Alert At RVOL %" setting at 0, then alerts will only be triggered if the current candle exceeds the 1.0 (100%) RVOL level. This happens far too frequently, so I prefer to put the alert at 2 or 3. If you change the "Alert At RVOL %" setting then alerts will be triggered if the RVOL percentage (blue number) exceeds your given value. The blue number is a percentage of the average, so if it’s at 1, then it’s 100% of the average.
Note: This tool does not work if you have after-hours or pre-market data displayed. The preferred setting for this tool is the 15' chart, with a 21 day look back period. It is also very useful on the daily chart when doing higher timeframe research.
TechniTrend: Relative Volume IndexRelative Volume Index (RVI)
Short Description:
Relative Volume Index (RVI) with customizable volume bands, moving averages, and alerts for high and low volume thresholds. Includes options for displaying daily and weekly relative volume for enhanced analysis.
Full Description:
The Relative Volume Index is a powerful and versatile tool designed to help traders easily identify volume trends and anomalies in the market. By comparing the current volume to its moving average, this indicator highlights significant increases or decreases in relative volume, allowing traders to catch potential breakouts, breakdowns, or volume spikes early on.
Key Features:
Relative Volume Comparison : Compares the current volume to the moving average volume over a customizable period, highlighting overbought and oversold conditions.
Volume Alerts : Customizable alert thresholds for high and low relative volume to quickly notify traders when volume exceeds predefined limits.
Custom Moving Averages : Choose from various moving average types (SMA, EMA, WMA) to calculate the average volume over a given length.
Volume Normalization : For better readability, volumes greater than 1000 are divided by 1000 and displayed with a 'K' suffix (thousands).
Volume Bands : Configurable high, average, and low volume bands for visual reference.
Daily Relative Volume : Option to display the daily relative volume in comparison to its daily average.
Weekly Average Volume : Option to display the weekly average volume for broader market trends.
Customization Options:
Length : Customize the period for calculating the moving average.
Volume Moving Average : Toggle to show/hide the volume moving average (normalized in 'K').
Alerts : Set thresholds for high and low volume alerts and configure alerts for immediate notification.
Volume Bands : Toggle to show/hide volume bands for easy visual identification of volume zones.
Daily/Weekly Relative Volume : Optional display of relative volume data on a daily and weekly basis.
This indicator provides traders with a more intuitive view of market volume dynamics, making it easier to spot significant volume changes and take action accordingly.
Recommended Settings:
High Volume Alert Threshold: 2.0
Low Volume Alert Threshold: 0.5
Length for Moving Average Calculation: 14
Show Weekly Average Volume: On for broader trend insights
Use this indicator to stay ahead of market moves by monitoring volume trends with precision.
Alerts:
High Volume Alert : Get notified when relative volume exceeds your high threshold.
Low Volume Alert : Get notified when relative volume drops below your low threshold.
